CryoSat conquers ice on Arctic lakes

The rapidly changing climate in the Arctic is not only linked to melting glaciers and declining sea ice, but also to thinning ice on lakes. The presence of lake ice can be easily monitored by imaging sensors and standard satellite observations, but now adding to its list of achievements, CryoSat can be used to measure the thickness of lake ice—another indicator of climate change.
CryoSat, one of ESA's Earth Explorer satellites, carries the first radar altimeter of its kind. The instrument is traditionally used to determine the thickness of sea ice floating in oceans and to monitor changes in vast ice sheets on land, providing evidence of Earth's diminishing polar ice.
Lakes in North America's Arctic and sub-Arctic regions cover between 15% and 40% of the landscape, and play an important role in the region's climate. They are also a vital resource for both society and an important habitat for aquatic wildlife.
Used as a platform for activities such as fishing, hunting and travel, knowledge of ice thickness is important for assessing safety. Monitoring changes in water volume and levels are also important for the supply of water for domestic, commercial and industrial use.
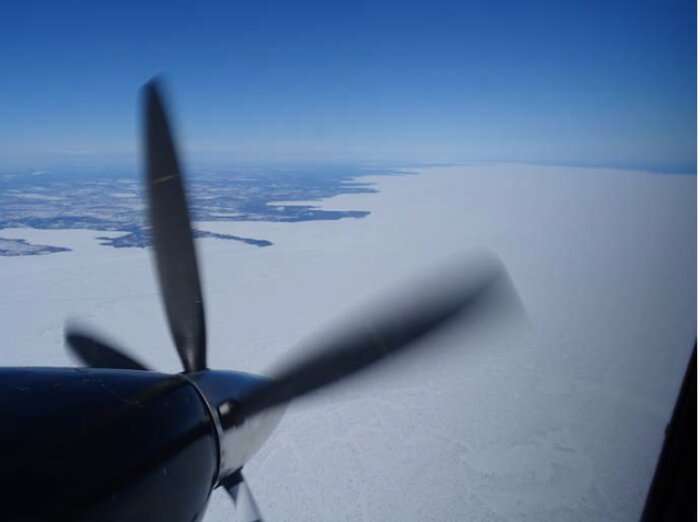
Great Slave Lake
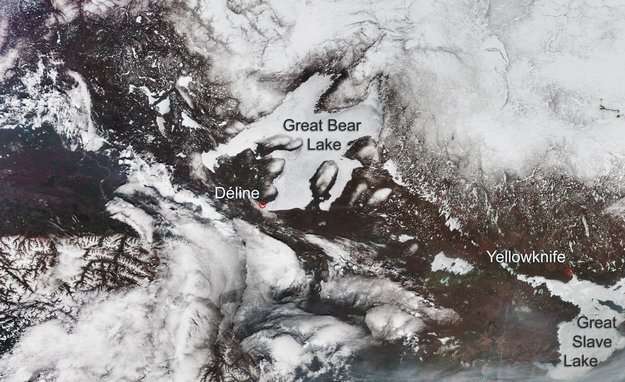
For the first time, CryoSat's altimeter has been used to measure the thickness of ice in the Great Slave Lake and the Great Bear Lake, in the Northwest Territory of Canada. Scientists from the University of Alberta and York University have documented their findings in a paper published in the Institute of Electrical and Electronics Engineers Transactions on Geoscience and Remote Sensing.

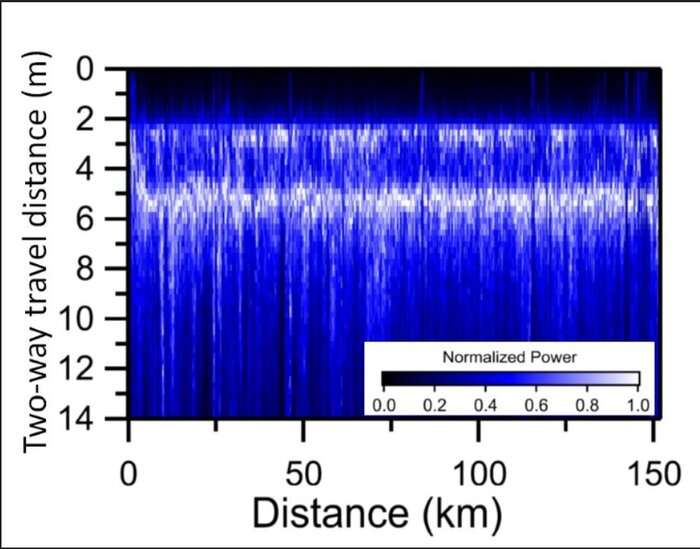
The Great Slave Lake and the Great Bear Lake were chosen for their flat and smooth icy surfaces, and scientists were able to distinguish radar reflections from both ice-free and ice-covered areas. By subtracting the travel times of the radar signals between the ice surface and ice bottom, they were able to measure the thickness of the ice floating on the lake.
Radargram of Great Slave Lake
The distance between the two reflections increased during winter, representing the seasonal thickening of the lake ice, and were then accurately validated with in situ drill-hole measurements.
Christian Haas from the University of Bremen (formerly at York and Alberta), said, "Thanks to CryoSat, we are able to study seasonal changes and cycles of ice thickness, as well as volume and variability for many other smaller lakes in the sub-Arctic.

"Although we have chosen to study the two largest lakes in the region, the same method can be applied to many other smaller lakes.
"In addition to monitoring ice thickness, the method could also be used to retrieve lake water levels and volume throughout winter."
Jerome Bouffard, CryoSat's data quality manager, says "We are delighted to see such results coming from CryoSat. Its data can provide key information over multiple surfaces that are critical to scientists' understanding of the role that ice plays in the Earth system, at both local and global scales."
Provided by European Space Agency


