Team creates high-fidelity images of Sun's atmosphere

In 1610, Galileo redesigned the telescope and discovered Jupiter's four largest moons. Nearly 400 years later, NASA's Hubble Space Telescope used its powerful optics to look deep into space—enabling scientists to pin down the age of the universe.
Suffice it to say that getting a better look at things produces major scientific advances.
In a paper published on July 18 in The Astrophysical Journal, a team of scientists led by Craig DeForest—solar physicist at Southwest Research Institute's branch in Boulder, Colorado—demonstrate that this historical trend still holds. Using advanced algorithms and data-cleaning techniques, the team discovered never-before-detected, fine-grained structures in the outer corona—the Sun's million-degree atmosphere—by analyzing images taken by NASA's STEREO spacecraft. The new results also provide foreshadowing of what might be seen by NASA's Parker Solar Probe, which after its launch in the summer 2018 will orbit directly through that region.
The outer corona is the source of the solar wind, the stream of charged particles that flow outward from the Sun in all directions. Measured near Earth, the magnetic fields embedded within the solar wind are intertwined and complex, but what causes this complexity remains unclear.
"In deep space, the solar wind is turbulent and gusty," said DeForest. "But how did it get that way? Did it leave the Sun smooth, and become turbulent as it crossed the solar system, or are the gusts telling us about the Sun itself?"
Answering this question requires observing the outer corona—the source of the solar wind—in extreme detail. If the Sun itself causes the turbulence in the solar wind, then we should be able to see complex structures right from the beginning of the wind's journey.
But existing data didn't show such fine-grained structure—at least, until now.
"Previous images of the corona showed the region as a smooth, laminar structure," said Nicki Viall, solar physicist at NASA's Goddard Space Flight Center in Greenbelt, Maryland, and coauthor of the study. "It turns out, that apparent smoothness was just due to limitations in our image resolution."
The study
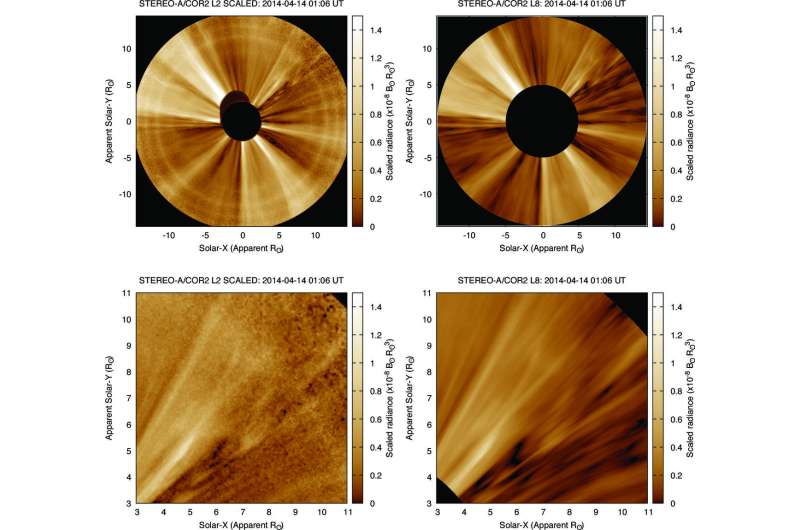
To understand the corona, DeForest and his colleagues started with coronagraph images—pictures of the Sun's atmosphere produced by a special telescope that blocks out light from the (much brighter) surface.
These images were generated by the COR2 coronagraph aboard NASA's Solar and Terrestrial Relations Observatory-A, or STEREO-A, spacecraft, which circles the Sun between Earth and Venus.
In April 2014, STEREO-A would soon be passing behind the Sun, and scientists wanted to get some interesting data before communications were briefly interrupted.
So they ran a special three-day data collection campaign during which COR2 took longer and more frequent exposures of the corona than it usually does. These long exposures allow more time for light from faint sources to strike the instrument's detector—allowing it to see details it would otherwise miss.
But the scientists didn't just want longer-exposure images—they wanted them to be higher resolution. Options were limited. The instrument was already in space; unlike Galileo they couldn't tinker with the hardware itself. Instead, they took a software approach, squeezing out the highest quality data possible by improving COR2's signal-to-noise ratio.
What is signal-to-noise ratio?
The signal-to-noise ratio is an important concept in all scientific disciplines. It measures how well you can distinguish the thing you care about measuring—the signal—from the things you don't—the noise.
For example, let's say that you're blessed with great hearing. You notice the tiniest of mouse-squeaks late at night; you can eavesdrop on the whispers of huddled schoolchildren twenty feet away. Your hearing is impeccable—when noise is low.
But it's a whole different ball game when you're standing in the front row of a rock concert. The other sounds in the environment are just too overpowering; no matter how carefully you listen, mouse-squeaks and whispers (the signal, in this case) can't cut through the music (the noise).
The problem isn't your hearing—it's the poor signal-to-noise ratio.
COR2's coronagraphs are like your hearing. The instrument is sensitive enough to image the corona in great detail, but in practice its measurements are polluted by noise—from the space environment and even the wiring of the instrument itself. DeForest and his colleagues' key innovation was in identifying and separating out that noise, boosting the signal-to-noise ratio and revealing the outer corona in unprecedented detail.
The analysis
The first step towards improving signal-to-noise ratio had already been taken: longer-exposure images. Longer exposures allow more light into the detector and reduce the noise level—the team estimates noise reduction by a factor of 2.4 for each image, and a factor of 10 when combining them over a 20-minute period.
But the remaining steps were up to sophisticated algorithms, designed and tested to extract out the true corona from the noisy measurements.
They filtered out light from background stars (which create bright spots in the image that are not truly part of the corona). They corrected for small (few-millisecond) differences in how long the camera's shutter was open. They removed the baseline brightness from all the images, and normalized it so brighter regions wouldn't wash out dimmer ones.
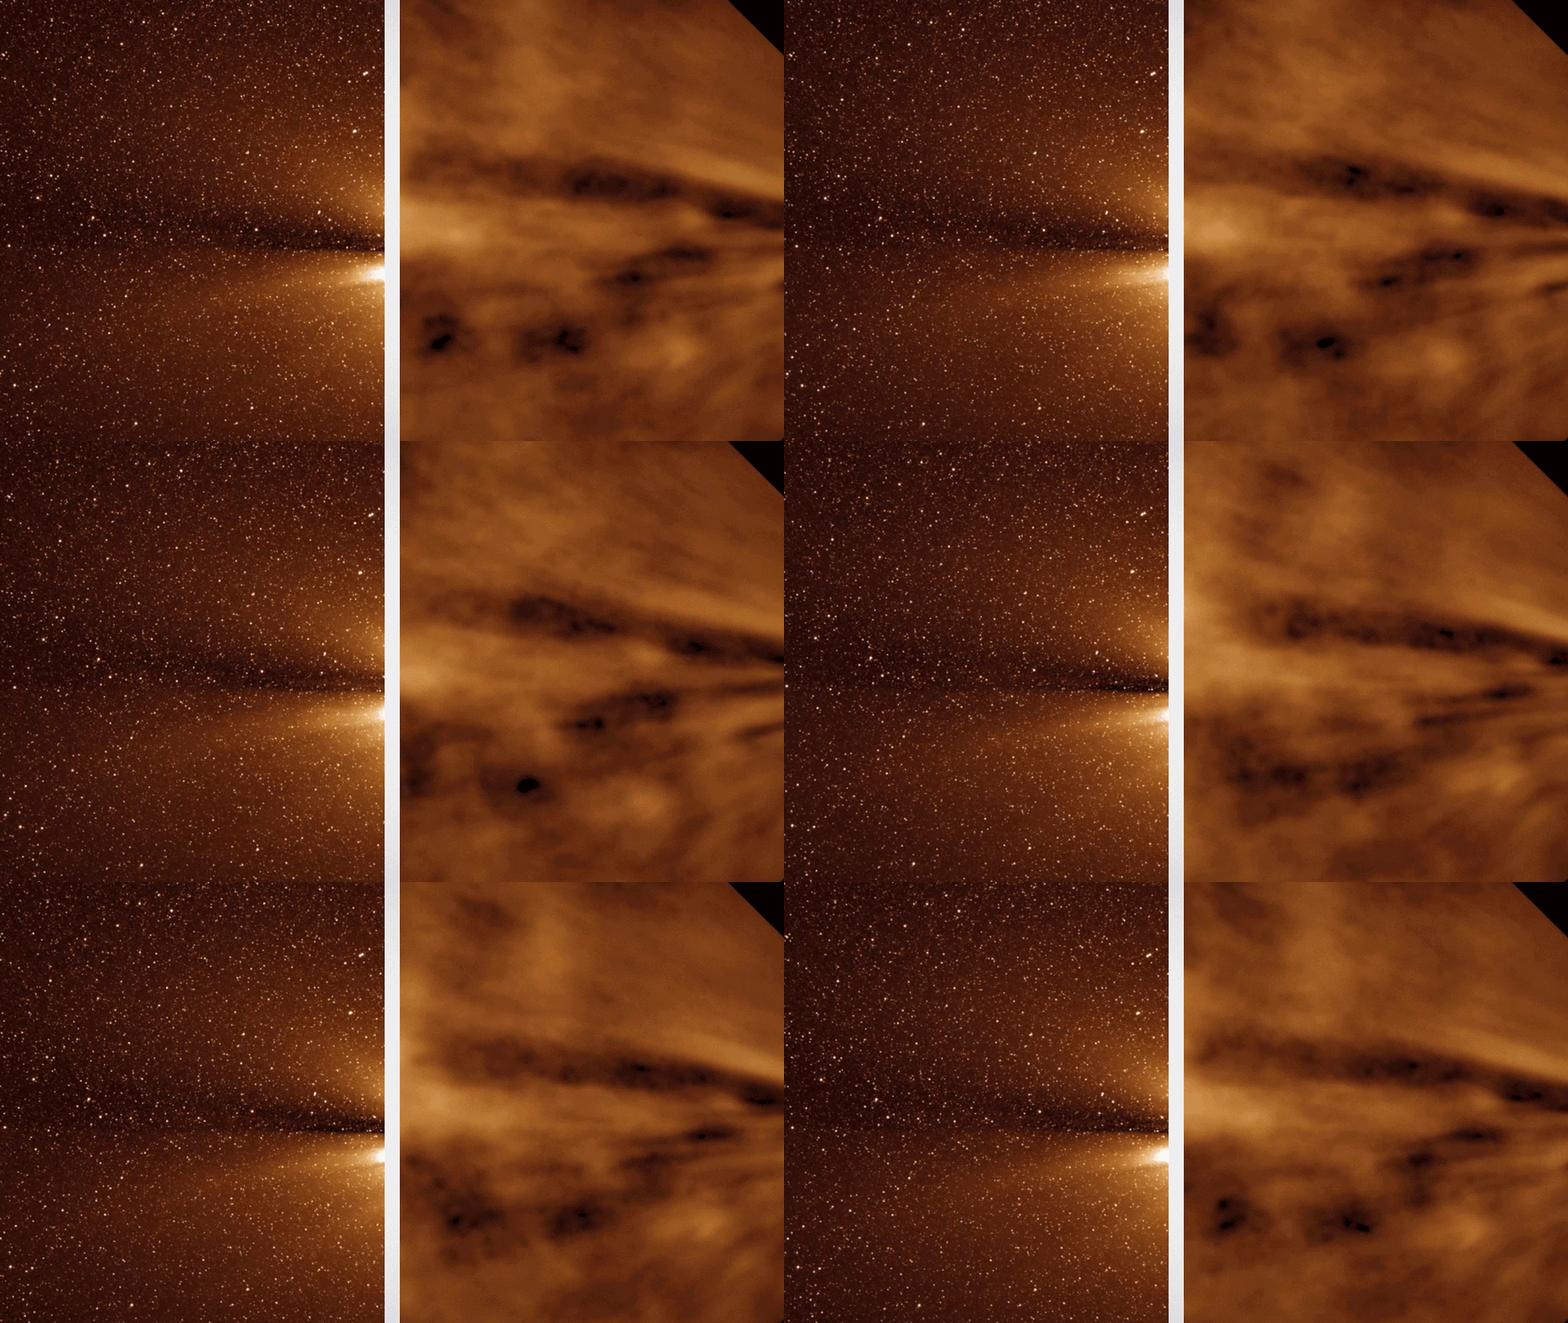
But one of the most challenging obstacles is inherent to the corona: motion blur due to the solar wind. To overcome this source of noise, DeForest and colleagues ran a special algorithm to smooth their images in time.
Smoothing in time—with a twist
If you've ever done a "double-take," you know a thing or two about smoothing in time. A double-take—taking a second glance, to verify your first one—is just a low-tech way of combining two "measurements" taken at different times, into one measurement that you can be more confident in.
Smoothing in time turns this idea into an algorithm. The principle is simple: take two (or more) images, overlap them, and average their pixel values together. Random differences between the images will eventually cancel out, leaving behind only what is consistent between them.
But when it comes to the corona, there's a problem: it's a dynamic, persistently moving and changing structure. Solar material is always moving away from the Sun to become the solar wind. Smoothing in time would create motion blur—the same kind of blurring you see in photographs of moving objects. That's a problem if your goal is to see fine detail.
To undo motion blur from the solar wind, the scientists used a novel procedure: while they did their smoothing, they estimated the speed of the solar wind and shifted the images along with it.
To understand how this approach works, think about taking snapshots of the freeway as cars drive past. If you simply overlapped your images, the result would be a big blurry mess—too much has changed between each snapshot.
But if you could figure out the speed of traffic and shift your images to follow along with it, suddenly the details of specific cars would become visible.
For DeForest and his coauthors, the cars were the fine-scale structures of the corona, and the freeway traffic was the solar wind.
Of course there are no speed limit signs in the corona to tell you how fast things are moving. To figure out exactly how much to shift the images before averaging, they scooted the images pixel-by-pixel, correlating them with one another to compute how similar they were. Eventually they found the sweet spot, where the overlapping parts of the images were as similar as possible. The amount of shift corresponded to an average solar wind speed of about 136 miles per second. Shifting each image by that amount, they lined up the images and smoothed, or averaged them together.
"We smoothed, not just in space, not just in time, but in a moving coordinate system," DeForest said. "That allowed us to create motion blur that was determined not by the speed of the wind, but by how rapidly the features changed in the wind."
Now DeForest and his collaborators had high-quality images of the corona—and a way to tell how much it was changing over time.
The results
The most surprising finding wasn't a specific physical structure—it was the simple presence of physical structure in and of itself.

Compared with the dynamic, turbulent inner corona, scientists had considered the outer corona to be smooth and homogenous. But that smoothness was just an artifact of poor signal-to-noise ratio:
"When we removed as much noise as possible, we realized that the corona is structured, all the way down to the optical resolution of the instrument," DeForest said.
Like the individual blades of grass you see only when you're up close, the corona's complex physical structure was revealed in unprecedented detail. And from among that physical detail, three key findings emerged.
The structure of coronal streamers
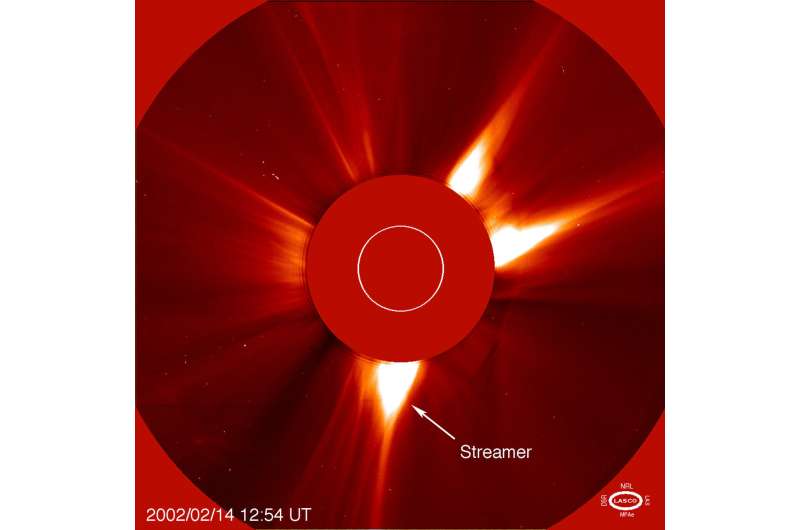
Coronal streamers—also known as helmet streamers, because they resemble a knight's pointy helmet—are bright structures that develop over regions of the Sun with enhanced magnetic activity. Readily observed during solar eclipses, magnetic loops on the Sun's surface are stretched out to pointy tips by the solar wind and can erupt into coronal mass ejections, or CMEs, the large explosions of matter that eject parts of the Sun into surrounding space.
DeForest and his coauthors' processing of STEREO observations reveals that streamers themselves are far more structured than previously thought.
"What we found is that there is no such thing as a single streamer," DeForest said. "The streamers themselves are composed of myriad fine strands that together average to produce a brighter feature."
The Alfvén zone
Where does the corona end and the solar wind begin? One definition points to the Alfvén surface, a theoretical boundary where the solar wind starts moving faster than waves can travel backward through it. At this boundary region, disturbances happening at a point farther away in the traveling solar material can never move backwards fast enough to reach the Sun.
"Material that flows out past the Alfvén surface is lost to the Sun forever," DeForest said.
Physicists have long believed the Alfvén surface was just that—a surface, or sheet-like layer where the solar wind suddenly reached a critical speed. But that's not what DeForest and colleagues found.
"What we conclude is that there isn't a clean Alfvén surface," DeForest said. "There's a wide 'no-man's land' or `Alfvén zone' where the solar wind gradually disconnects from the Sun, rather than a single clear boundary."
The observations reveal a patchy framework where, at a given distance from the Sun, some plasma is moving fast enough to stop backward communication, and nearby streams are not. The streams are close enough, and fine enough, to jumble the natural boundary of the Alfvén surface to create a wide, partially-disconnected region between the corona and the solar wind.

A mystery at 10 solar radii
But the close look at coronal structure also raised new questions.
The technique used to estimate the speed of the solar wind pinpointed the altitudes, or distances from the Sun's surface, where things were changing rapidly. And that's when the team noticed something funny.
"We found that there's a correlation minimum around 10 solar radii," DeForest said.
At a distance of 10 solar radii, even back-to-back images stopped matching up well. But they became more similar again at greater distances—meaning that it's not just about getting farther away from the Sun. It's as if things suddenly change once they hit 10 solar radii.
"The fact that the correlation is weaker at 10 solar radii means that some interesting physics is happening around there," DeForest said. "We don't know what it is yet, but we do know that it is going to be interesting."
Where we go from here
The findings create headway in a long-standing debate over the source of the solar wind's complexity. While the STEREO observations don't settle the question, the team's methodology opens up a missing link in the Sun-to-solar-wind chain.
"We see all of this variability in the solar wind just before it hits the Earth's magnetosphere, and one of our goals was to ask if it was even possible that the variability was formed at the Sun. It turns out the answer is yes," Viall said.
"It allows us for the first time to really probe the connectivity through the corona and adjust how tangled we think the magnetic field gets in the corona versus the solar wind," DeForest added.
These first observations also provide key insight into what NASA's upcoming Parker Solar Probe will find, as the first ever mission to gather measurements from within the outer solar corona. That spacecraft will travel to a distance of 8.86 solar radii, right into the region where interesting things may be found. DeForest and colleagues' results allow them to make predictions of what Parker Solar Probe may observe in this region.
"We should expect steep fluctuations in density, magnetic fluctuations and reconnection everywhere, and no well-defined Alfvén surface," DeForest said.
Complemented by Parker Solar Probe's in situ measurements, long exposure imaging and noise reduction algorithms will become even more valuable to our understanding of our closest star.
More information: The Highly Structured Outer Solar Corona, Astrophysical Journal (2018). DOI: 10.3847/1538-4357/aac8e3 , iopscience.iop.org/article/10. … 847/1538-4357/aac8e3
Journal information: Astrophysical Journal
Provided by NASA


