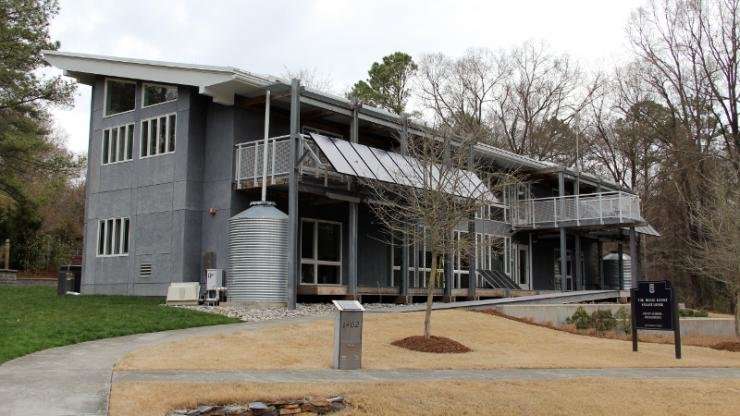
Smart home dashboard to better visualize energy usage

Duke's Smart Home generates a lot of data about its energy usage, but no one understands what it means—yet. To make sense of it all, an interdisciplinary team of students is developing a visualization dashboard that will convey consumption data in an easily comprehendible manner.
"We want to make the Smart Home more integrated with the technology around it," said Harvey Shi, a senior double majoring in biomedical engineering and computer science, and president of the Smart Home. The team, led by Rahul Sengottuvelu, a sophomore in electrical and computer engineering, includes students from various disciplines, from computer science to visual studies.
Sujay Garlanka, a junior studying electrical and computer engineering, said the Smart Home has e-gauges installed that show how much energy the appliances are consuming. The e-gauges constantly push data to the internet via an application programming interface—or API—which is a set of subroutine definitions, protocols and tools for building application software. However, the current dashboard's visualization is unintuitive.
Using a virtual machine and Python script to put the data on their own database, the students are experimenting with TABLEAU, a data visualization software, to design an interface that is easy to follow.
"If we have all this data in our database, we can visualize it however we want," Garlanka said.
Right now, the team has mainly been trying to understand what the data can show and discern what residents would be interesting in seeing.
"What questions are interesting to ask the data? Are there particular patterns that are interesting....we don't really know that," said Camilla Vargas, a senior majoring in visual studies.
Vargas, who is writing her thesis on the Smart Home, became involved with the project after hearing about it from a professor. She said working with the team has been fun but also challenging with everyone looking at the problem from different disciplines and perspectives.
"We all speak different languages...and that's the challenge of every student group, figuring out how to communicate with each other," Vargas said.
Vargas went on to say that the Smart Home is a continuously evolving space that has "found its identity" multiple times since it was first built. She said it started off as an engineering-focused construction project and then became a makerspace once the Home was complete. But with the opening of the Innovation Co-Lab and Design Pod, the Smart Home must find its identity again.
"Data might be the next hub," Vargas said.
Provided by Duke University


