NASA-led study solves a methane puzzle

A new NASA-led study has solved a puzzle involving the recent rise in atmospheric methane, a potent greenhouse gas, with a new calculation of emissions from global fires. The new study resolves what looked like irreconcilable differences in explanations for the increase.
Methane emissions have been rising sharply since 2006. Different research teams have produced viable estimates for two known sources of the increase: emissions from the oil and gas industry, and microbial production in wet tropical environments like marshes and rice paddies. But when these estimates were added to estimates of other sources, the sum was considerably more than the observed increase. In fact, each new estimate was large enough to explain the whole increase by itself.
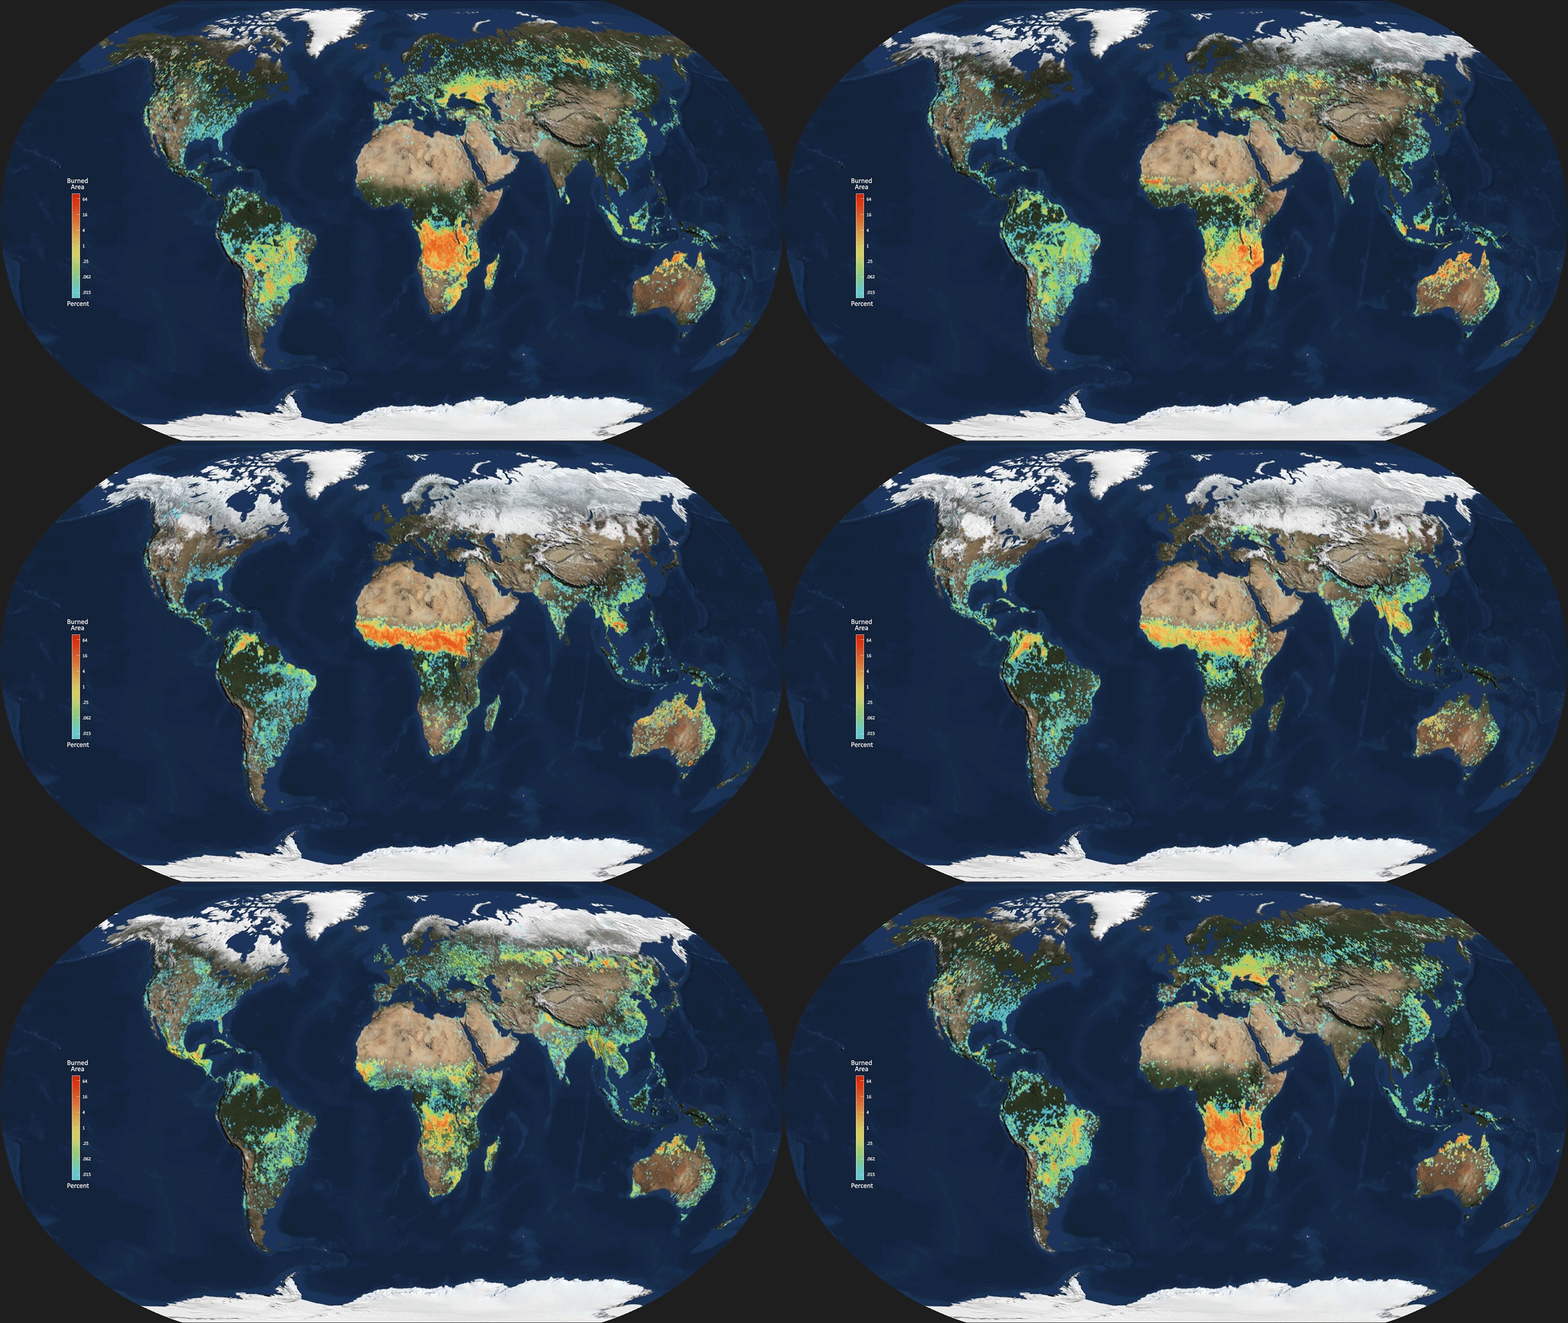
Scientist John Worden of NASA's Jet Propulsion Laboratory in Pasadena, California, and colleagues focused on fires because they're also changing globally. The area burned each year decreased about 12 percent between the early 2000s and the more recent period of 2007 to 2014, according to a new study using observations by NASA's Moderate Resolution Imaging Spectrometer satellite instrument. The logical assumption would be that methane emissions from fires have decreased by about the same percentage. Using satellite measurements of methane and carbon monoxide, Worden's team found the real decrease in methane emissions was almost twice as much as that assumption would suggest.
When the research team subtracted this large decrease from the sum of all emissions, the methane budget balanced correctly, with room for both fossil fuel and wetland increases. The research is published in the journal Nature Communications.
Most methane molecules in the atmosphere don't have identifying features that reveal their origin. Tracking down their sources is a detective job involving multiple lines of evidence: measurements of other gases, chemical analyses, isotopic signatures, observations of land use, and more. "A fun thing about this study was combining all this different evidence to piece this puzzle together," Worden said.
Carbon isotopes in the methane molecules are one clue. Of the three methane sources examined in the new study, emissions from fires contain the largest percentage of heavy carbon isotopes, microbial emissions have the smallest, and fossil fuel emissions are in between. Another clue is ethane, which (like methane) is a component of natural gas. An increase in atmospheric ethane indicates increasing fossil fuel sources. Fires emit carbon monoxide as well as methane, and measurements of that gas are a final clue.
Worden's team used carbon monoxide and methane data from the Measurements of Pollutants in the Troposphere instrument on NASA's Terra satellite and the Tropospheric Emission Spectrometer instrument on NASA's Aura to quantify fire emissions of methane. The results show these emissions have been decreasing much more rapidly than expected.
Combining isotopic evidence from ground surface measurements with the newly calculated fire emissions, the team showed that about 17 teragrams per year of the increase is due to fossil fuels, another 12 is from wetlands or rice farming, while fires are decreasing by about 4 teragrams per year. The three numbers combine to 25 teragrams a year—the same as the observed increase.
Worden's coauthors are at the National Center for Atmospheric Research, Boulder, Colorado; and the Netherlands Institute for Space Research and University of Utrecht, both in Utrecht, the Netherlands.
More information: More information about the Global Fire Emissions Database, including maps of burned area and fire emissions, can be found here: www.globalfiredata.org/
Journal information: Nature Communications
Provided by NASA


