NASA satellite images show evolution of Hurricane Harvey

Hurricane Harvey continues to churn toward the Texas coast, and is expected to make landfall as a major hurricane sometime late Aug. 25 or early Aug. 26, according to the National Hurricane Center. It would be the first major hurricane to make landfall in the United States since 2005.
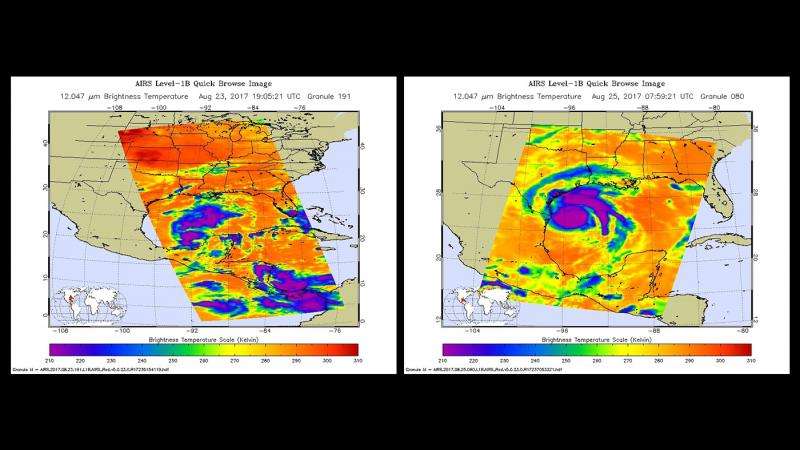
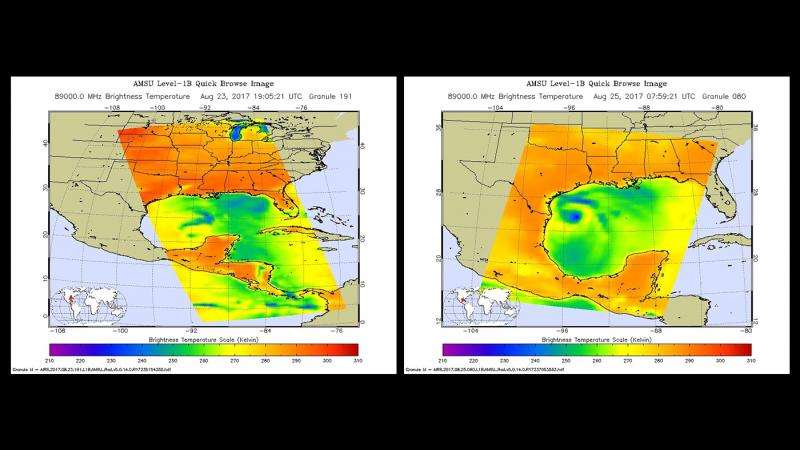
The rapid intensification of Harvey is depicted in this set of false-color images from NASA's Atmospheric Infrared Sounder (AIRS) and Advanced Microwave Sounding Unit (AMSU) instruments on NASA's Aqua satellite. The earlier images were acquired at 3:05 p.m. CDT (19:05 UTC) on Wednesday, Aug. 23, when Harvey became a tropical storm soon after crossing from the Yucatan Peninsula over warm waters in the Gulf of Mexico. The later images were acquired at 2:59 a.m. CDT (7:59 UTC) on Friday, Aug. 25, when Harvey was a Category 2 hurricane.
Warm colors in the infrared images (red, orange, yellow) show areas with little cloud cover. Cold colors (blue, purple) show areas covered by clouds that have developed sufficiently to reach high, cold altitudes, creating strong thunderstorms. The darker the color, the colder and higher the clouds and the stronger the thunderstorms. In the microwave images, blue indicates areas of heavy rainfall beneath the coldest clouds.
These images illustrate how, over a 36-hour period, Harvey became more organized (shown by its more circular shape and more-developed rain bands in the later images), intensified (shown by the growing area of blue and purple colors in the infrared) and moved northwest toward Texas. The microwave images show how the areas with rain have grown in area and intensity.
Together, these two instruments give a detailed picture of the atmospheric conditions in and around a storm like Harvey. These observations are used by weather forecasters to predict how Harvey will move and change strength.

More information: For more information on AIRS, visit: airs.jpl.nasa.gov/
Provided by NASA


