July 17, 2017 report
Data from NASA's Solar Dynamics Observatory offer clues about sun's coronal irradiance

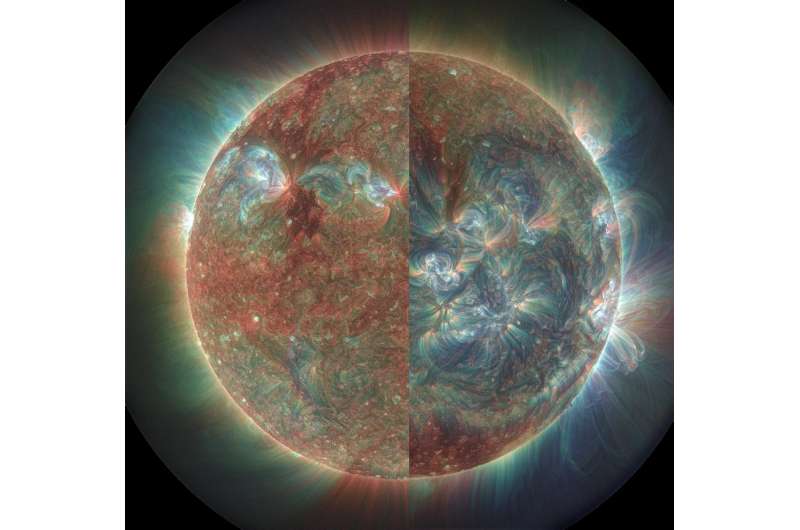
(Phys.org)—A pair of researchers with Aberystwyth University in the U.K. has used data from NASA's Solar Dynamics Observatory to learn more about how the sun's corona behaves over differing stages of its 11-year cycle. In their paper published on the open access site Science Advances, Huw Morgan and Youra Taroyan describe attributes of the sun they observed over time and what they discovered about the "quiet corona" and its possible impact on us back here on Earth.
As the researchers note, most research to date regarding the sun's corona has covered relatively small datasets, which provides only a limited view of what happens with the sun over longer periods of time—specifically, over the course of an entire coronal cycle. But now, thanks to NASA's Solar Dynamics Observatory, the pair were able to look at data that covered the time between 2010 and 2017, which covers a large portion of one cycle.
Scientists have known for some time that the corona experiences solar cycles of approximately 11 years—solar flare activity grows and ebbs over the course of a single cycle. But until now, there has been no way to measure what happens over the course of a single cycle to explain the changes that occur.
In their analyses of the data, the researchers focused on what scientists call the quiet corona—the part of the corona that remains relatively quiet while sunspots are occurring in other areas. It is a little researched area, the researchers note, due to the more attractive sunspot areas. They also looked at extreme ultraviolet irradiance emitted from different coronal regions. They report that they found that all throughout a cycle, the quiet corona dominated emissions of EUV and that more active regions demonstrated higher variability. But they also found that main emission measurements of both the quiet corona and those regions that were more active were what they described as "remarkably constant." Their findings demonstrate, the pair note, that monitoring sunspots is not an adequate means for predicting EUV irradiance—more measurements and study are required to better understand the factors at play.

More information: Huw Morgan et al. Global conditions in the solar corona from 2010 to 2017, Science Advances (2017). DOI: 10.1126/sciadv.1602056
Abstract
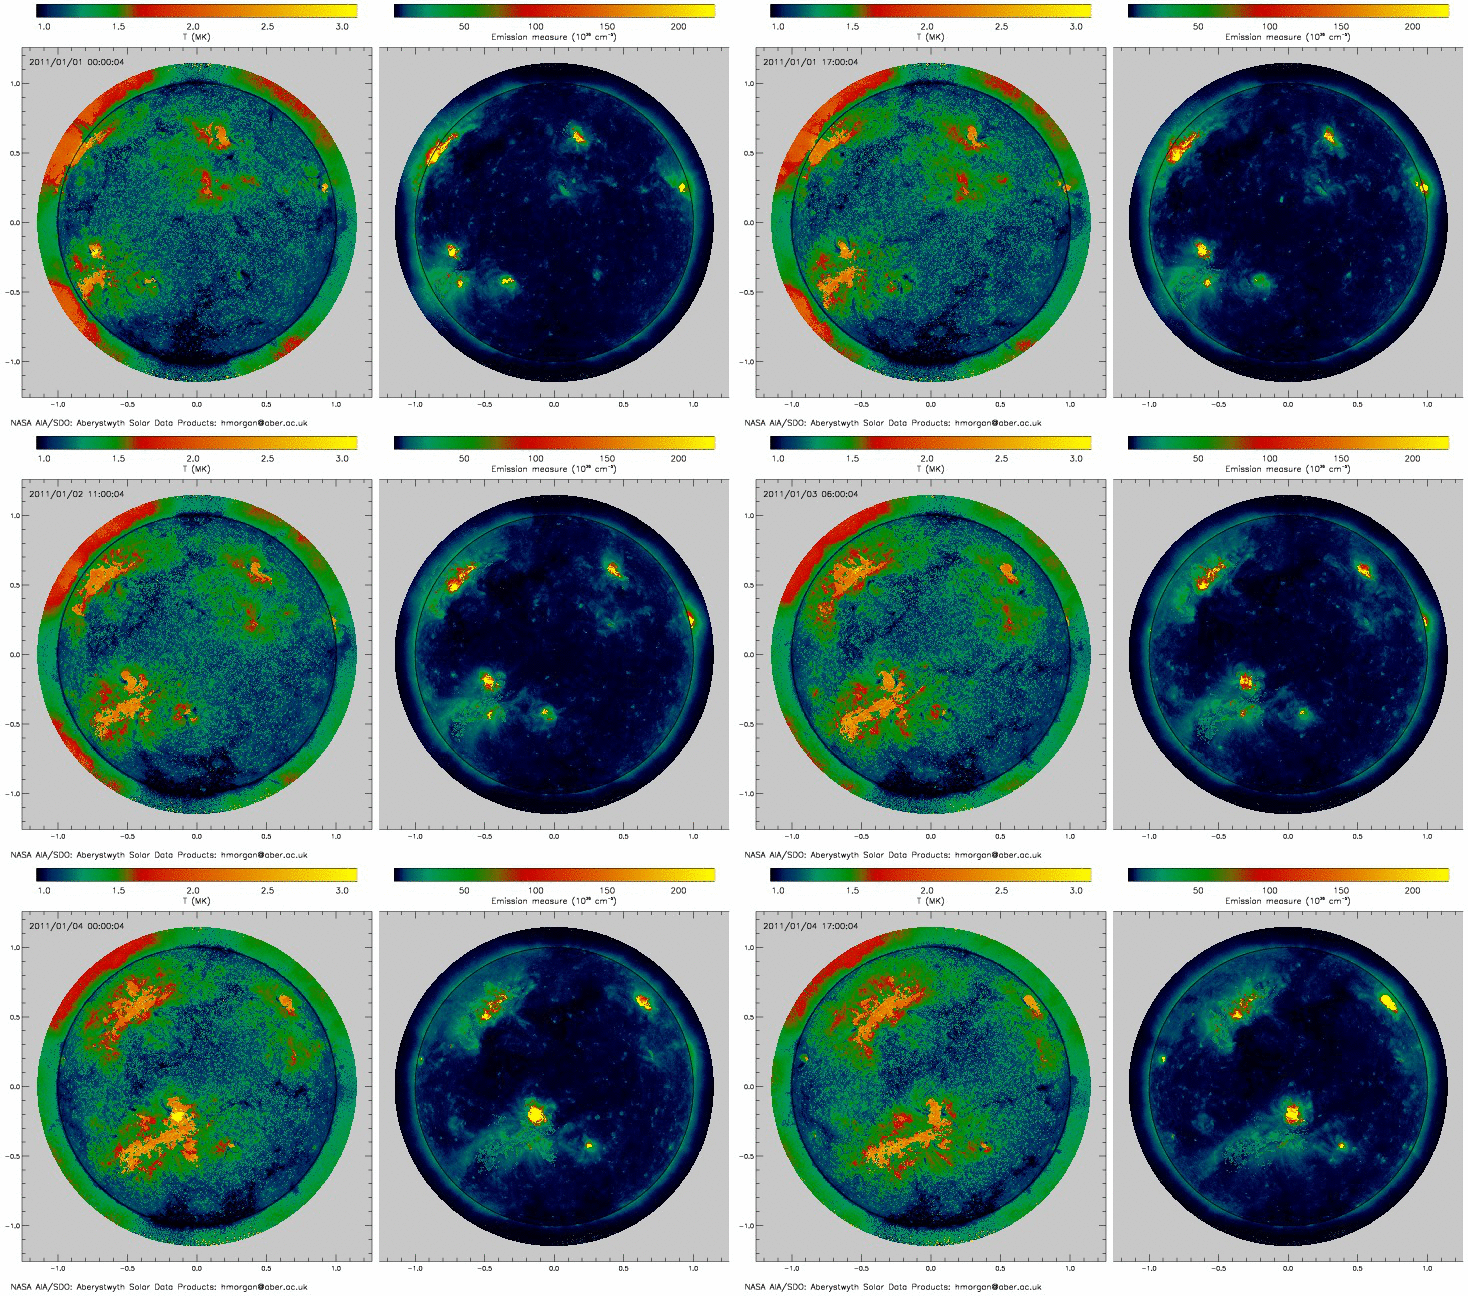
Through reduction of a huge data set spanning 2010–2017, we compare mean global changes in temperature, emission measure (EM), and underlying photospheric magnetic field of the solar corona over most of the last activity cycle. The quiet coronal mean temperature rises from 1.4 to 1.8 MK, whereas EM increases by almost a factor of 50% from solar minimum to maximum. An increased high-temperature component near 3 MK at solar maximum drives the increase in quiet coronal mean temperature, whereas the bulk of the plasma remains near 1.6 MK throughout the cycle. The mean, spatially smoothed magnitude of the quiet Sun magnetic field rises from 1.6 G in 2011 to peak at 2.0 G in 2015. Active region conditions are highly variable, but their mean remains approximately constant over the cycle, although there is a consistent decrease in active region high-temperature emission (near 3 MK) between the peak of solar maximum and present. Active region mean temperature, EM, and magnetic field magnitude are highly correlated. Correlation between sunspot/active region area and quiet coronal conditions shows the important influence of decaying sunspots in driving global changes, although we find no appreciable delay between changes in active region area and quiet Sun magnetic field strength. The hot coronal contribution to extreme ultraviolet (EUV) irradiance is dominated by the quiet corona throughout most of the cycle, whereas the high variability is driven by active regions. Solar EUV irradiance cannot be predicted accurately by sunspot index alone, highlighting the need for continued measurements.
Journal information: Science Advances
© 2017 Phys.org


