Quantifying the effects of climate change

Last year was the hottest on record, Arctic sea ice is on the decline and sea levels continue to rise. In this context, satellites are providing us with an unbiased view of how our climate is changing and the effects it is having on our planet.
Estimates show that the global sea level is rising by about 3 mm a year. This is one of the major threats of global warming, especially for low-lying coastal areas.
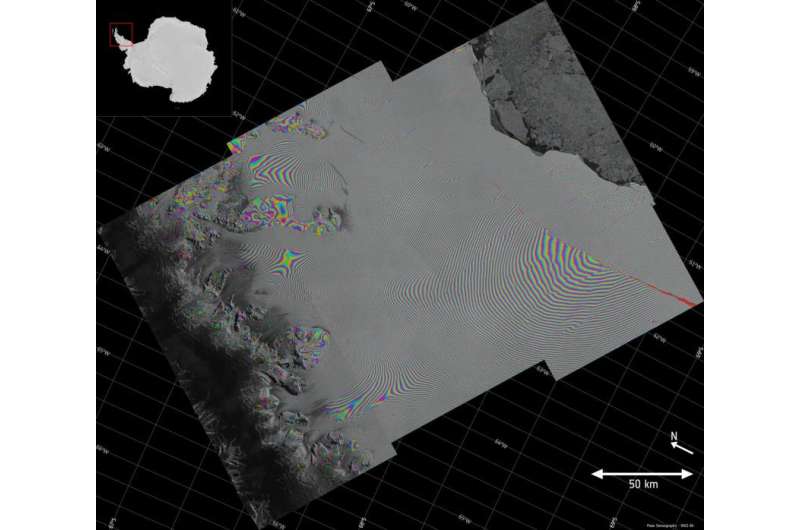
Identifying the individual contributors to sea-level rise is a complicated challenge in climate science. Earth-observing satellites are mapping sea-level changes, which vary across the globe, but the data from satellites can also be used to quantify the amount of water coming from various sources such as melting glaciers and ice sheets, as well as the thermal expansion of ocean water due to rising temperatures.
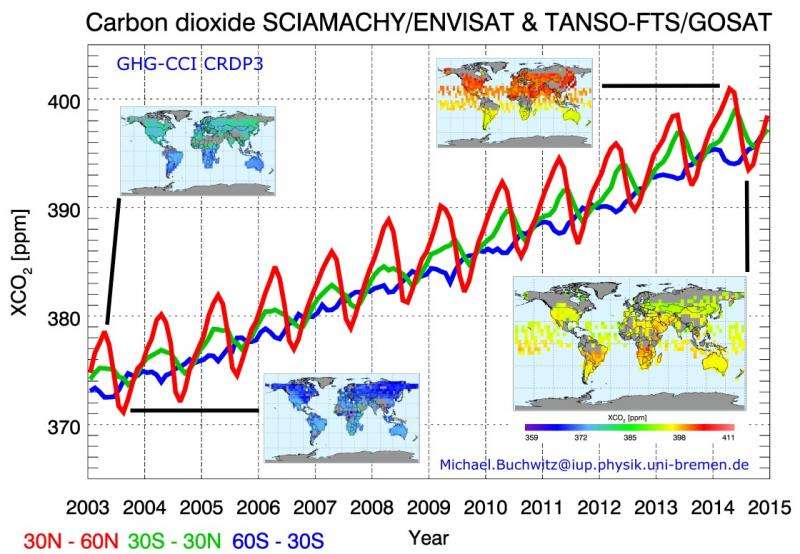
Space's role in monitoring our planet doesn't stop there: from greenhouse gas emissions to ozone, sea ice to soil moisture and more, spaceborne instruments provide us with the independent and scientific facts which show that our climate is changing.
"Climate and Earth system science are essential to position countries at the forefront of the green revolution," said Josef Aschbacher, Director of ESA's Earth Observation Programmes.
"Space-based Earth observation plays an increasingly important role given the satellites' global reach with the same monitoring instruments. Europe is committed to contribute to a better understanding of planet Earth and to its preservation."
The global, consistent coverage that satellite data provide is ideal for the type of research undertaken by climate scientists. But the long-term series of data needed by climate scientists –30 years or more – is significantly longer than the lifetime of satellite missions.
omparing data acquired by different satellites is complicated as technology is constantly improving and there are often gaps in the data between satellite missions. To overcome this, ESA created the Climate Change Initiative, or CCI, which integrates datasets derived from different Earth-observing missions to produce the most comprehensive global, long-term records possible for each factor influencing Earth at large – called Essential Climate Variables.
These datasets show clear evidence of changes to our climate.
For a comprehensive view of our planet's changing climate through the eyes of satellites, check out a new digital book for iPad and Android tablets featuring interactive maps and video interviews with top scientists.

More information: Scientists interested in accessing Essential Climate Variable datasets are welcome to visit the CCI Open Data Portal.
Provided by European Space Agency


