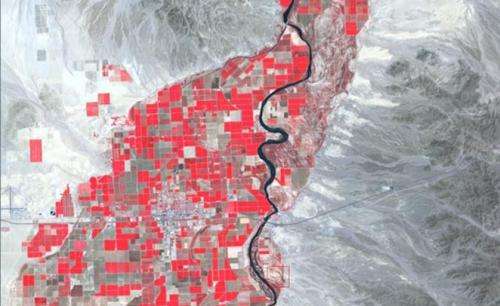
Project's cropland map of the world to be most detailed ever

(Phys.org) —Data harvested from the sky may give researchers a view into the future of food production while opening insights to the implications of climate change.
The five-year, $3.5 million project funded by NASA will make use of existing satellite imagery to produce the first-ever global survey of croplands. Northern Arizona University assistant research professor Temuulen "Teki" Sankey, a remote sensing ecologist, will put her skills to work as part of a multi-institute team trying to answer the question of "Where is all the food going to come from?" to feed a growing world population.
"This has never been done before at the scale we're looking at," said Sankey, noting the 30-meter resolution satellite images will allow her and other researchers to identify eight different crops and changes in acreage over the past four decades.
The Landsat images are stored and managed by the U.S. Geological Survey and are publicly available. But examining a world's worth of them in 30-meter pixels over 40 years takes a cluster of supercomputers and a series of intricate algorithms.
"If you want to map the entire world in this kind of detail, it takes a massive, massive amount of data," Sankey said. "In recent years, the technology has caught up with the kinds of data that a person could imagine using."
Yet all that technology will still need an assist. To validate that conclusions drawn from the satellite images are accurate requires "ground data."
According to Sankey, "We are going to look at our own map and ask, 'Really, is it true that 20,000 acres are being cropped in this location?' Then we need someone from that area to tell us that yes, it's true, or that our analysis is inaccurate."
Over the years, members of the research team have compiled a library of such information, but "we are trying to come up with a systematic and intelligent way to survey the Earth," Sankey said. One possibility is a web page to which the public can contribute.
Sankey's own research has focused on the study of vegetation cover to determine land-use changes over decades of time. She explained that climate science may gain from the mapping project because of the details it will reveal about natural vegetation lost to cropland expansion. Climate scientists rely on maps in coarser pixels that may not show such details, she said, which means there may be less or more vegetation than currently believed to absorb carbon dioxide.
"With our maps, they can come up with better estimates of what's going on with carbon storage globally," Sankey said. "Then they can produce a more accurate model for climate change."
Provided by Northern Arizona University


