Two centuries of Manchester's maps go online
Over 300 historical maps spanning 200 years of Mancunian history have been digitised and published online by The University of Manchester Library.
The collection of maps and plans of the city from the 18th century to the middle of the 20th century, mostly from the Library's Special Collections, will be freely available, allowing users to zoom into street level.
Also digitised by the Library are a series of maps from Manchester City Council - not seen in public for 60 years- showing the extent of bomb damage to the city during WW2.
The work, carried out by the Library's Centre for Heritage Imaging and Collection Care (CHICC), comprises maps by private surveyors, detailed Ordnance Survey maps, and plans of the Manchester Ship Canal.
Included is the first large-scale map of Manchester, produced by William Green in 1794, and Joseph Adshead's Victorian map of the Township of Manchester.
A selection of plans show the development of Manchester Ship Canal, and a street map collection from 1750 to 1930 shows Manchester and Salford's explosive growth.
The Library's Map Librarian, Donna Sherman, said: " These maps provide a fascinating visual resource, giving a wealth of information to the public, historians, sociologists, architects, and archaeologists.
"Thanks to CHICC, we're delighted they are now available for free on the University of Manchester Library's website."
Manchester City Council's executive member for culture and leisure, Councillor Rosa Battle, said: "By collaborating with the University of Manchester to make this fascinating collection of maps freely accessible online, we will give historians and Manchester residents alike real insight into how our city has developed over the centuries and how it was affected by bombing during the Second World War."
The bomb maps were put together using intelligence from the Chief Constable, who sent telegrams detailing the damage to the city engineer's office.
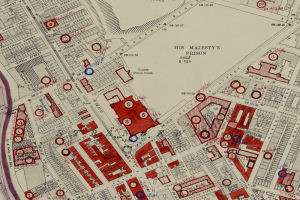
It was the office Junior's job to colour the map, showing fire bombs as red dots, high explosives as blue dots and line mines as green dots.
Red shaded buildings represent demolished buildings while pink shaded buildings were damaged but still standing.
Many of the maps were digitised at the request of Dr Martin Dodge, a geographer from the University's School of Environment and Development.
He said: "The bomb maps are of interest, as they show the true extent of the damage caused by the bombs during the war: in particular the Christmas Blitz of 22 to 24 December 1940, killing an estimated 684 people.
"What we can see from the map that the Germans hit more of the commercial and civic parts of the city, whereas its industry was left unscathed: so in effect it's a map of failure.
"The maps provide a fantastic opportunity for the public to see how their street was affected."
More information:
www.library.manchester.ac.uk/s … es/imagecollections/
www.library.manchester.ac.uk/d … education/workshops/
www.manchester.gov.uk/libraries/arls/
Provided by University of Manchester


